
Tirohanga Ohanga mō Te Moana a Toi: Māori Entrepreneurs in Te Moana ā Toi and New Zealand for 2001 and 2006
Table of contents
- Foreword
- Key Facts
- Defining and Measuring Entrepreneurship
- Māori Entrepreneurship in New Zealand and the Bay of Plenty Region, for 2001 and 2006
- Purpose of the Report
- Background
- Methodology
- New Zealand's Growth of the Māori Workforce and Entrepreneurs
- Increase in the Proportion of Māori Female Entrepreneurs
- Entrepreneurs Per Region
- Focus on Industries
- Māori Entrepreneurs in the Bay of Plenty Region by Industry (Full-time)
- Māori Entrepreneurs (Full-time) Median Total Personal Income in the Bay of Plenty Region
- Highest Qualification
- Technical Notes
- Appendices
- References
- Disclaimer and Copyright
Māori Entrepreneurs in the Bay of Plenty Region by Industry (Full-time)
Graph 2: Proportion of Māori Entrepreneurs1 Working Full-time2, Aged 15 Years and Over, for the Bay of Plenty Region3 by Industry4, 2001 & 2006 Censuses.
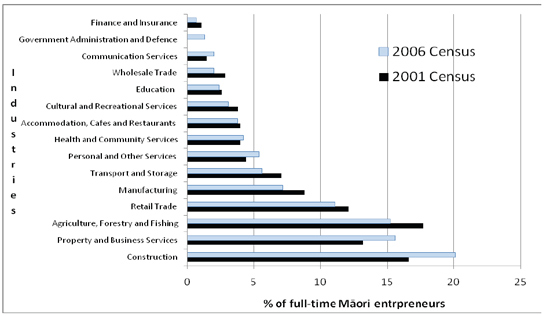
Source: Statistics New Zealand’s 2001 & 2006 Censuses of Population and Dwellings. All data relates to the employed working age population aged 15 years and over.
Excludes the Mining; and Electricity, Gas and Water supply, #Government Administration & Defence (for 2001 only) industries due to Statistics New Zealand’s confidentiality rules.
1 = Entrepreneurs used this report includes: Māori employers and Māori self-employed and without employees.
2 = Employed includes: Full-time and Part-time employed. Full-time is equal to people working 30 or more hours per week. Also, employed is related to work in the 7 days prior 5th March 2006. The analysis shown in tables and graphs is for the job a person worked the most hours in.
3 = the Bay of Plenty region refers to the Bay of Plenty regional council and includes the following areas: Taupo District; Western Bay of Plenty District, Tauranga City, Rotorua District, Whakatane District, Kawerau District, and Opotiki District.
4 = ANZSIC is the Australian and New Zealand Standard Industrial Classification. The ANZSIC96 version used for this analysis is version 4.1.
Graph 2 above shows the proportion of full-time Māori entrepreneurs by industry in the Bay of Plenty region for 2001 & 2006 18. It shows the following three industries in this region had a high proportion of Māori entrepreneurs:
- Construction, 16.6% (or 225) in 2001, compared to 20.1% (or 333) in 2006;
- Property and business services, 13.2% (or 180) in 2001, compared to 15.6% (or 258) in 2006; and
- Agriculture, forestry and fishing, 17.7% (or 240) in 2001, compared to 15.2% (or 252) in 2006.
The growth rate19 increases from 2001 and 2006 for full-time Māori entrepreneurs in the Bay of Plenty region were the highest in the following four industries:
- Communication services, 57.1%;
- Personal and other services, 50.0%;
- Construction, 48.0%; and
- Property and business services, 43.3%.
Conversely, over this period, the largest growth rate decreases occurred in the following two industries:
- Finance and insurance, -20.0 %; and
- Wholesale trade, -15.4 %.
The three industries with the largest percentage point changes20 from 2001 and 2006 were:
- Construction, 3.6 percentage points;
- Property and business services, 2.3 percentage points; and
- Personal and other services, 1.0 percentage points.
Similarly, the four industries with the largest negative percentage point changes over this period were:
- Agriculture, forestry and fishing, -2.4 percentage points;
- Manufacturing, -1.6 percentage points;
- Transport and storage, -.1.4 percentage points; and
- Retail trade, -1.1 percentage points.
2. The industries affected are mentioned at the foot of each relevant graph.
Graph 3: Number of Māori Entrepreneurs1 Working Full-time2 Aged 15 Years and Over in the Bay of Plenty Region3 by Industry Type4, 2001 AND 2006 Censuses.
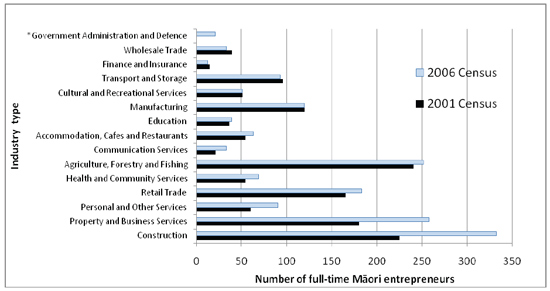
Source: Statistics New Zealand's 2001 and 2006 Censuses. Note: Excludes the mining, and Electricity, Gas and Water Supply industries for both 2001 and 2006, and also excludes *2001 data for the Government Administration industry due to Statistics New Zealand’s confidentiality rules applied to low numbers.
All data relates to the employed working age population aged 15 years and over, who are working 30 or more hours per week (full-time).
1 = Entrepreneurs used this report includes: Māori employers and Māori self-employed and without employees.
2 = Employed includes: Full-time and Part-time employed. Full-time is equal to people working 30 or more hours per week. Also, employed is related to work in the 7 days prior to 6 March 2001 and 5th March 2006. The analysis shown in tables and graphs is for the job a person worked the most hours in.
3 = the Bay of Plenty region refers to the Bay of Plenty regional council and includes the following areas: Taupo District; Western Bay of Plenty District, Tauranga City, Rotorua District, Whakatane District, Kawerau District, and Opotiki District.
4 = ANZSIC is the Australian and New Zealand Standard Industrial Classification. The ANZSIC96 version used for this analysis is version 4.1.
Graph 3 above shows the number of full-time Māori entrepreneurs in the Bay of Plenty region by industry type, for both 2001 and 2006. A key highlight of this graph shows the numerical significance of the construction; property and business services; and agriculture, forestry and fishing industries and the changes in these numbers from 2001 and 2006. Whereas in percentage terms the following industries showed the largest increase from 2001 to 2006: Communication services (57.1%); Personal and other services (50%); Construction (48%); and Property and Business Services (43.3%). Similarly, the largest percentage declines were in the following industries: Finance and Insurance (-20.0%); and wholesale trade (-15.4%).
18 For the data related to the percentages used in graph 2 refer to appendix 2 located towards the end of this report.
19 The growth rate (or crude growth rate) in this case shows the numeric change in the number of entrepreneurs between 2001 and 2006, and represents this change as a proportion or percentage of 2001. Also note that some industries have been excluded due to Statistics New Zealand’s data confidentiality rules applied to low numbers. Therefore, no information is available for some industries in Graphs 1 and 2. The industries affected are mentioned at the foot of each relevant graph.
20 Percentage point change is defined as the simple subtraction or difference of two percentages. In this case the difference between the percentages for each industry for 2001 and 2006. Also note that some industries have been excluded due to Statistics New Zealand’s data confidentiality rules applied to low numbers. Therefore, no information is available for some industries in Graphs 1 and