
Tirohanga Ohanga mō Te Moana a Toi: Māori Entrepreneurs in Te Moana ā Toi and New Zealand for 2001 and 2006
Table of contents
- Foreword
- Key Facts
- Defining and Measuring Entrepreneurship
- Māori Entrepreneurship in New Zealand and the Bay of Plenty Region, for 2001 and 2006
- Purpose of the Report
- Background
- Methodology
- New Zealand's Growth of the Māori Workforce and Entrepreneurs
- Increase in the Proportion of Māori Female Entrepreneurs
- Entrepreneurs Per Region
- Focus on Industries
- Māori Entrepreneurs in the Bay of Plenty Region by Industry (Full-time)
- Māori Entrepreneurs (Full-time) Median Total Personal Income in the Bay of Plenty Region
- Highest Qualification
- Technical Notes
- Appendices
- References
- Disclaimer and Copyright
Focus on Industries
In 2001 and 2006, almost half of Māori entrepreneurs worked in either of the following industries: construction (2001, 17.1%; 2006, 19.7%); property and business services (2001, 14.4%; 2006, 17.3%); or agriculture, forestry and fishing (2001, 15.2%; 2006, 12.3%). Worked refers to both employers and the self employed without employees. From 2001 and 2006, the biggest increases occurred in the property and business service and construction industries (both 3 percentage points). The largest decreases were in the agriculture, forestry and fishing (-3 percentage points) and manufacturing (-2 percentage points) industries. Graph 1 below shows the % of Māori entrepreneurs working in each industry in 2001 and 200617. The underlying data behind graph 1 can be found in appendix 1 towards the end of this report.
Graph 1: Māori Entrepreneurs 1 as a % of Industry Type 2 for New Zealand, 2001 and 2006 Censuses
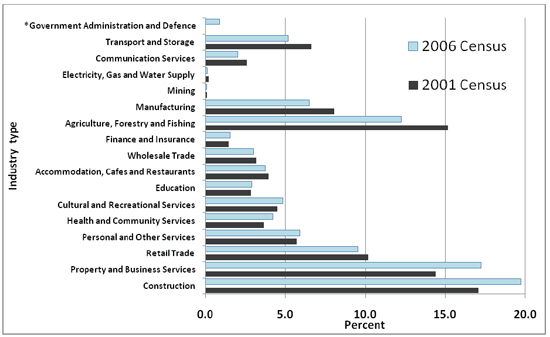
Source: Statistics New Zealand’s Census of Population and Dwellings, 2001 and 2006.
*These figures use data for the employed working age population only, i.e. people 15 years of age and over. The percentage of Māori entrepreneurs involved in the government administration and defence industry in 2001 is not available because of Statistics New Zealand’s data confidentiality rules applied to low numbers.
1 = Entrepreneurs are defined in this report includes: Māori employers and Māori self-employed and without employees.
2 = ANZSIC is the Australian and New Zealand Standard Industrial Classification.
The ANZSIC96 version used for this analysis is version 4.1.
17 Refer to appendix 1 (near the end of this report) to see the data behind graph 1).