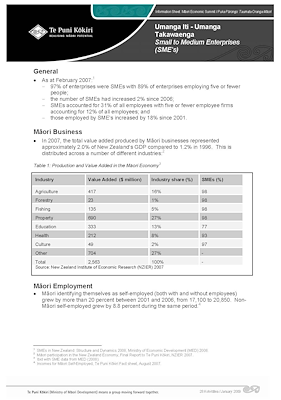
Small to Medium Enterprises
Table of contents
Māori Employment
- Māori identifying themselves as self-employed (both with and without employees) grew by more than 20 percent between 2001 and 2006, from 17,100 to 20,850. Non-Māori self-employed grew by 8.8 percent during the same period.4
- However, the percentage of self-employed Māori and Māori employers has largely remained static between 2001 and 2006, although there has been a slight increase in Māori employers. It should also be noted that the self-employment rates for Māori are approximately half those of most other ethnic groups.5
Table 2: Percentage Ethnic Groups by Status in Employment 2001-2006
| Ethnic group (grouped total responses) |
2006 Census Employment status | 2001 Census Employment status | ||||||
|---|---|---|---|---|---|---|---|---|
| Paid employee | Self employed and without employees | Employer | Unpaid family worker | Paid employee | Self employed and without employees | Employer | Unpaid family worker | |
| European | 77.1 | 12.9 | 7.9 | 2 | 75.9 | 13.4 | 8.4 | 2.3 |
| Māori | 88.3 | 6.5 | 3.3 | 1.9 | 88.1 | 6.5 | 3.1 | 2.2 |
| Pacific peoples | 93 | 4.3 | 1.6 | 1.2 | 92.6 | 4.4 | 1.6 | 1.3 |
| Asian | 78.8 | 12 | 6.5 | 2.7 | 74.3 | 14.3 | 7.4 | 3.9 |
| Other | 75 | 13.8 | 9 | 2.2 | 80.1 | 12 | 5.9 | 2 |
| Total | 78.4 | 12.2 | 7.4 | 2.1 | 77.3 | 12.7 | 7.7 | 2.3 |
Source: MED (2008)
4 Incomes for Māori Self-Employed, Te Puni Kōkiri Fact sheet, August 2007.
5 Ibid.
6 MED (2008).