Evaluation of Investments in the Strengthening Management and Governance Programme
Table of contents
- Acknowledgements
- Executive Summary
- 1. Evaluation of Investments in Strengthening Management and Governance
- 2. What Has the SMG Programme Achieved?
- 3. Possible Enhancements to the SMG Programme
- 4. Conclusion
- Appendix One: Methodology
- Appendix Two: Results of the SMG Online Survey
- Appendix Three: References
Appendix Two: Results of the SMG Online Survey
Questions 1 and 2 asked the name of the organisation and the designation of the person completing the survey.
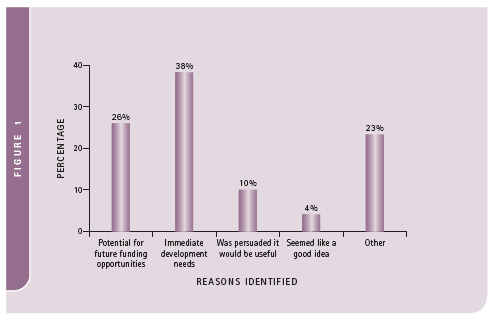
Figure 1: Question 3 – Why did your organisation decide to participate in the SMG programme?
Notes:
- Multiple responses were allowed, thus resulting in more than the number of total respondents, n=45.
- The percentages shown are calculated by dividing the number of responses per item by the total number of responses, n=84.
- Rounding-off of percentages to whole numbers may result in totals being greater or less than 100%.
Table 1: Question 4a – Has the SMG programme assisted your organisation to achieve (or improve) in the following areas?
| Significantly | Considerably | To some extent | Not at all | Don’t know, can’t say | |
|---|---|---|---|---|---|
| Clear vision, mission and value statements | 19% | 53% | 26% | 2% | 0% |
| Leadership and management direction | 32% | 41% | 20% | 7% | 0% |
Note: Rounding-off of percentages to whole numbers may result in totals being greater or less than 100%.
Table 2: Question 4b – Has the SMG programme assisted your organisation to achieve (or to improve) in the following areas?
| Governance | Significantly | Considerably | To some extent | Not at all | Don’t know, can’t say |
|---|---|---|---|---|---|
| An appropriately structured governance board | 16% | 49% | 23% | 12% | 0% |
| A high performing governance board | 9% | 45% | 36% | 9% | 0% |
| A governance board with a clear understanding of its roles, responsibilities and legal obligations | 19% | 40% | 33% | 9% | 0% |
| A governance board comprising members with relevant skills | 5% | 45% | 45% | 5% | 0% |
| A governance board with a clear understanding of its stewardship responsibilities | 14% | 41% | 36% | 7% | 2% |
| A governance board operating with a strategic focus | 16% | 49% | 28% | 7% | 0% |
Note: Rounding-off of percentages to whole numbers may result in totals being greater or less than 100%.
Table 3: Question 4c – Has the SMG programme assisted your organisation to achieve (or to improve) in the following areas?
| Management | Significantly | Considerably | To some extent | Not at all | Don’t know, can’t say |
|---|---|---|---|---|---|
| Appropriate human resource management including succession planning, recruitment, remuneration, performance management, code of conduct and staff training | 14% | 50% | 32% | 5% | 0% |
| Robust financial management including financial/accounting systems, cashflow management, payments and payroll, and internal controls | 25% | 43% | 20% | 11% | 0% |
| Strong organisational structure including computer, IT systems, facilities management, and equipment | 20% | 41% | 30% | 7% | 2% |
| Positive stakeholder management including relationship management, stakeholder management, communications, and strategic partnerships and collaborations | 7% | 57% | 25% | 11% | 0% |
| Sound risk management including business continuity and disaster recovery, and risk monitoring | 11% | 45% | 34% | 9% | 0% |
| Rigorous planning processes including strategic, business and financial and HR planning | 16% | 61% | 18% | 5% | 0% |
| Effective monitoring and evaluation of business processes, performance and service delivery | 7% | 43% | 43% | 7% | 0% |
| Clear operational policies and procedures including quality systems, delegations and decision making | 23% | 40% | 30% | 7% | 0% |
Note: Rounding-off of percentages to whole numbers may result in totals being greater or less than 100%.
Table 4: Question 5 – Did your organisation’s involvement with the SMG programme give you increased:
| Area / Focus | Significantly | Considerably | To some extent | Not at all | Don’t know, can’t say |
|---|---|---|---|---|---|
| Understanding of your organisation’s strengths | 39% | 41% | 18% | 2% | 0% |
| Understanding of your organisation’s weaknesses | 39% | 43% | 18% | 0% | 0% |
| Confidence in your decision-making processes | 25% | 41% | 30% | 5% | 0% |
| Appreciation of your accountability to Māori organisations | 21% | 47% | 23% | 9% | 0% |
| Understanding of your mandate and representation | 28% | 40% | 21% | 12% | 0% |
| Confidence in negotiating with government and other funding organisations | 18% | 41% | 30% | 10% | 2% |
| Confidence in ensuring the ongoing sustainability of your organisation | 26% | 35% | 30% | 7% | 2% |
| Motivation to deliver a high quality service | 34% | 48% | 11% | 7% | 0% |
Note: Rounding-off of percentages to whole numbers may result in totals being greater or less than 100%.
Figure 2: Significance of the SMG programme’s contribution to Māori organisations (a graph of the above results)
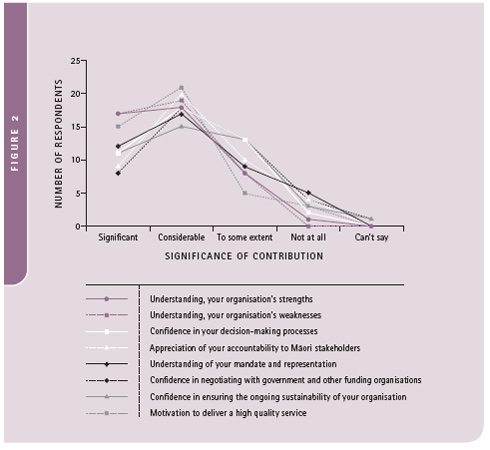
Figure 3: Question 6 – How would you rate the contribution of the SMG programme to your organisation?
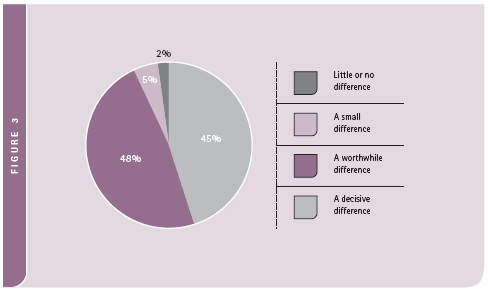
Table 5: Question 7 – How does your organisation rate the performance of the SMG programme in the following areas?
| Area / Focus | Excellent | Very Good | Good | Low | Very low |
|---|---|---|---|---|---|
| Te Puni Kōkiri appointment of independent assessors | 36% | 44% | 18% | 0% | 2% |
| Independence of assessor’s advice | 44% | 31% | 2% | 2% | 0% |
| Flexibility of approach | 51% | 38% | 16% | 2% | 0% |
| Confidentiality of assessor’s report | 52% | 30% | 18% | 0% | 0% |
| Value added to your organisation by the assessor’s report and tools | 44% | 31% | 20% | 4% | 0% |
| Solution orientation of the assessor’s report | 42% | 31% | 20% | 4% | 2% |
| Professionalism of the assessors | 62% | 24% | 11% | 2% | 0% |
| Respect of assessors towards the tikanga, kawa and kaupapa of the organisation | 62% | 27% | 11% | 0% | 0% |
| Assessor’s genuine concern for your organisation | 58% | 27% | 16% | 0% | 0% |
| Availability of remedial support from Te Puni Kōkiri | 33% | 24% | 24% | 11% | 0% |
| Other support from Te Puni Kōkiri | 30% | 25% | 27% | 14% | 5% |
| Improved relationship with Te Puni Kōkiri | 22% | 38% | 27% | 11% | 2% |
Note: Rounding-off of percentages to whole numbers may result in totals being greater or less than 100%.
Table 6: Question 8 – Is your organisation still working on the assessor’s recommendations?
| No. of respondents | Percentage | |
|---|---|---|
| Yes | 45 | 100% |
| No | 0 | 0% |
| Total | 45 | 100% |
Table 7: Question 9 – In relation to the assessor’s recommendations, approximately what proportion of these has your organisation implemented?
| No. of respondents | Percentage | |
|---|---|---|
| All of them | 5 | 11% |
| Most of them | 25 | 56% |
| About half of them | 5 | 11% |
| About a quarter of them | 1 | 2% |
| A few of them | 7 | 16% |
| None of them | 1 | 2% |
| No answer | 1 | 2% |
| Total | 45 | 100% |
Note: Rounding-off of percentages to whole numbers may result in totals being greater or less than 100%.
Table 8: Question 10 – Of the recommendations not implemented, what was the main reason for not following through? (Multiple responses allowed)
| No. of respondents | Percentage | |
|---|---|---|
| Lack of resources | 17 | 33% |
| Changes in organisational priorities | 18 | 35% |
| Lack of relevance | 4 | 8% |
| Disagreement with assessor’s view | 1 | 2% |
| Other | 12 | 23% |
| Total | 52 | 101% |
Note: Rounding-off of percentages to whole numbers may result in totals being greater or less than 100%.
Multiple responses account for greater than 45 total respondents.
Table 9: Question 11 – What aspects of the programme could be improved on if resources were available?
| Common Themes |
|---|
| Coaching/mentoring by experts |
| Co-funding for remediation work |
| Additional funding for remediation work |
| Follow-up work after implementation of recommendations |
| A complete suite that covers assessment, remediation work and review of progress |
| Facilitated self-analysis |
| Commitment from programme recipients, otherwise refund the money |
Table 10: Question 12 – What other resources (either government or private) could assist your organisation with carrying out its governance and management functions?
| Common Themes |
|---|
| Governance and management training (e.g. best practice governance workshops) |
| Governance toolkits |
| Coaching/mentoring |
| A governance help line |
| Financial support to attract high calibre trustees |
| Funding to attend Institute of Directors training |
| Support for strategic development |
| Training and monitoring of recommendations |
| Access to templates (e.g. evaluation, business plan, IT checklist) |
| Forum for discussing governance and management issues |
Table 11: Question 13 – Who do you think should be providing the resources?
| Common Themes |
|---|
| Government (e.g. Te Puni Kōkiri) |
| Private sector |
| Private sector, facilitated by Te Puni Kōkiri |
| Co-funding |
| Māori providers |