Tirohanga Ohanga mō Te Moana a Toi: Māori Entrepreneurs in Te Moana ā Toi and New Zealand for 2001 and 2006
Table of contents
- Foreword
- Key Facts
- Defining and Measuring Entrepreneurship
- Māori Entrepreneurship in New Zealand and the Bay of Plenty Region, for 2001 and 2006
- Purpose of the Report
- Background
- Methodology
- New Zealand's Growth of the Māori Workforce and Entrepreneurs
- Increase in the Proportion of Māori Female Entrepreneurs
- Entrepreneurs Per Region
- Focus on Industries
- Māori Entrepreneurs in the Bay of Plenty Region by Industry (Full-time)
- Māori Entrepreneurs (Full-time) Median Total Personal Income in the Bay of Plenty Region
- Highest Qualification
- Technical Notes
- Appendices
- References
- Disclaimer and Copyright
Entrepreneurs Per Region
Table 5 shows that in 2001 and 2006, there were more Māori entrepreneurs living in Auckland than any other region. Next in size were the Waikato, Bay of Plenty and Wellington region’s in terms of its entrepreneurial counts. The percentage change from 2001 and 2006 shows an increase in Māori entrepreneurs in the Bay of Plenty region of 23.7%, this is slightly higher than the Māori entrepreneur national average increase of 23.3%.
Table 5: Number of Māori Entrepreneurs* and Māori Population by Regional Council, 2001 and 2006 Censuses
| Region | Number of Māori Entrepreneurs* | Increase in Māori Entrepreneurs 2001 -2006 | Māori regional population (aged 15 years and over) | Increase/Decrease in Māori regional population 2001 -2006 | Māori Entrepreneurs as a % of Māori regional population (aged 15 yrs and over) |
||||||
|---|---|---|---|---|---|---|---|---|---|---|---|
| 2001 | 2006 | Absolute change | % change | 2001 | 2006 | Absolute change | % change | 2001 | 2006 | % point change |
|
| Northland | 1,257 | 1,602 | 345 | 27.4 | 25,155 | 27,948 | 2,793 | 11.1 | 5.0 | 5.7 | 0.7 |
| Auckland | 4,806 | 5,856 | 1,050 | 21.8 | 80,835 | 88,806 | 7,971 | 9.9 | 5.9 | 6.6 | 0.6 |
| Waikato | 2,046 | 2,484 | 438 | 21.4 | 45,408 | 49,407 | 3,999 | 8.8 | 4.5 | 5.0 | 0.5 |
| Bay of Plenty | 1,839 | 2,274 | 435 | 23.7 | 39,648 | 43,539 | 3,891 | 9.8 | 4.6 | 5.2 | 0.6 |
| Gisborne | 507 | 576 | 69 | 13.6 | 12,378 | 12,954 | 576 | 4.7 | 4.1 | 4.4 | 0.4 |
| Hawke's Bay | 669 | 870 | 201 | 30.0 | 19,923 | 21,483 | 1,560 | 7.8 | 3.4 | 4.0 | 0.7 |
| Taranaki | 441 | 492 | 51 | 11.6 | 8,913 | 10,128 | 1,215 | 13.6 | 4.9 | 4.9 | -0.1 |
| Manawatu-Wanganui | 990 | 1,191 | 201 | 20.3 | 24,171 | 26,859 | 2,688 | 11.1 | 4.1 | 4.4 | 0.3 |
| Wellington | 1,887 | 2,274 | 387 | 20.5 | 32,493 | 36,396 | 3,903 | 12.0 | 5.8 | 6.2 | 0.4 |
| West Coast | 132 | 135 | 3 | 2.3 | 1,518 | 1,821 | 303 | 20.0 | 8.7 | 7.4 | -1.3 |
| Canterbury | 1,182 | 1,569 | 387 | 32.7 | 19,941 | 23,655 | 3,714 | 18.6 | 5.9 | 6.6 | 0.7 |
| Otago | 462 | 651 | 189 | 40.9 | 6,864 | 8,286 | 1,422 | 20.7 | 6.7 | 7.9 | 1.1 |
| Southland | 372 | 477 | 105 | 28.2 | 6,213 | 6,720 | 507 | 8.2 | 6.0 | 7.1 | 1.1 |
| Tasman | 135 | 159 | 24 | 17.8 | 1,647 | 1,932 | 285 | 17.3 | 8.2 | 8.2 | 0.0 |
| Nelson | 111 | 159 | 48 | 43.2 | 1,977 | 2,331 | 354 | 17.9 | 5.6 | 6.8 | 1.2 |
| Marlborough | 201 | 234 | 33 | 16.4 | 2,442 | 2,877 | 435 | 17.8 | 8.2 | 8.1 | -0.1 |
| Area Outside Region | 60 | 63 | 3 | 5.0 | 279 | 264 | -15 | -5.4 | 21.5 | 23.9 | 2.4 |
| Total | 17,091 | 21,069 | 3,978 | 23.3 | 329,799 | 365,406 | 35,607 | 10.8 | |||
Source: Statistics New Zealand’s, Census of Population and Dwellings, 2001 and 2006.
*Employed people aged 15 years of age and over.
Note: This data has been randomly rounded to protect confidentiality. Individual figures may not add up to totals, and values for the same data may vary in different tables.
Map 1: Number of Māori Entrepreneurs by Regional Council, 2006 Census
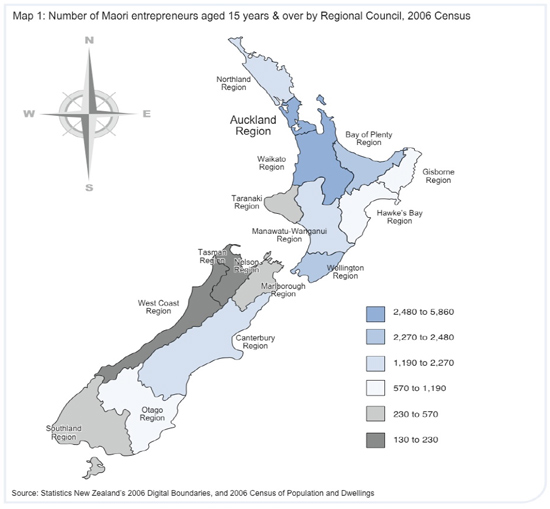
Map 1 above graphically depicts the number of Māori entrepreneurs in New Zealand by regional council areas for the 2006 Census. The Auckland and Waikato regions have the highest counts of Māori entrepreneurs in New Zealand followed by the Bay of Plenty and Wellington regions. The larger counts of Māori entrepreneurs in these regions can be explained in part by the large numbers of Māori in these regions. In 2006, Māori entrepreneurs in the Bay of Plenty region made up 5.2% of the total Māori in this region (aged 15 years and over).