The Implications of a Recession for the Māori Economy
Table of contents
Appendices
Treasury “Downside” Forecasts
| (Annual average % change, Year ending 31 March) |
2008 Actual |
2009 Forecast |
2010 Forecast |
2011 Forecast |
2012 Forecast |
2013 Forecast |
|---|---|---|---|---|---|---|
| Real GDP components | ||||||
| Private consumption | 3.3 | -0.2 | -0.2 | -0.5 | 0.9 | 1.8 |
| Residential investment | 3.8 | -22.0 | -18.8 | 6.3 | 14.1 | 18.4 |
| Market investment | 7.4 | 5.2 | -23.7 | 2.0 | 16.0 | 8.8 |
| Gross national expenditure | 4.5 | -0.1 | -4.1 | 1.0 | 4.2 | 4.0 |
| Exports of goods and services | 2.3 | -1.0 | -3.2 | 1.7 | 8.9 | 7.7 |
| Imports of goods and services | 9.7 | 3.0 | -14.0 | -2.7 | 7.3 | 6.9 |
| GDP (production measure) | 3.2 | -0.2 | -0.3 | 2.3 | 4.5 | 4.2 |
| Unemployment rate 1 | 3.7 | 5.0 | 7.2 | 7.1 | 5.9 | 4.8 |
| 90-day bank bill rate 2 | 8.8 | 5.0 | 3.5 | 3.2 | 4.0 | 5.0 |
| TWI 2 | 71.9 | 53.4 | 48.7 | 51.7 | 52.8 | 52.6 |
| CPI 3 | 3.4 | 3.1 | 3.1 | 1.0 | 1.2 | 1.5 |
| Current account balance (% GDP) | -8.0 | -9.7 | -10.6 | -5.6 | -3.1 | -3.5 |
| Nominal GDP level (deviation from main forecast, $billion) |
0.0 | -1.1 | -6.9 | -5.1 | -4.5 | -4.8 |
Sources: Statistics New Zealand, Reserve Bank of New Zealand, The Treasury
1 Percentage of labour force, March quarter, seasonally adjusted.
2 Average for March quarter.
3 Annual percentage change, March quarter.
Māori Employment
Table 1: Māori Labour Market Trends, September 1999-2008
| September Quarter | Labour Force Participation Rate 30 |
Employment Rate 31 | Unemployment Rate 32 | Youth Unemployment Rate 33 |
Long Term Unemployment Rate34 |
|---|---|---|---|---|---|
| 1999 | 62.0 | 52.8 | 14.8 | 24.3 | 5.9 |
| 2000 | 62.8 | 53.9 | 14.1 | 31.4 | 4.6 |
| 2001 | 63.5 | 55.7 | 12.3 | 27.7 | 4.2 |
| 2002 | 65.9 | 58.1 | 11.9 | 22.5 | 3.6 |
| 2003 | 65.7 | 59.3 | 9.7 | 20.7 | 2.9 |
| 2004 | 63.7 | 58.4 | 8.3 | 20.9 | 1.6 |
| 2005 | 67.1 | 60.8 | 9.4 | 28.3 | 2.3 |
| 2006 | 66.4 | 61.3 | 7.6 | 22.4 | 1.5 |
| 2007 | 67.4 | 62.0 | 8.0 | 23.7 | 1.3 |
| 2008 | 67.4 | 62.1 | 7.9 | 19.7 | 1.3 |
Source: Household Labour Force Survey, Statistics New Zealand (2008)
Table 1: Snapshot of Māori labour market outcomes, years to June 2000 and 2007
| 2003 (‘000) | 2008 (‘000) | 2003-2008 change (‘000) | 2003-2008 change (%) | |
|---|---|---|---|---|
| High-skilled occupations | 32.7 | 41.1 | 8.4 | 25.7 |
| Skilled occupations | 30.0 | 39.9 | 9.9 | 33.0 |
| Semi-skilled occupations | 100.4 | 102.3 | 1.9 | 1.9 |
| Low-skilled occupations | 21.8 | 22.6 | 0.8 | 3.7 |
Māori Labour Market Trends, years to June 2003, 2007 and 2008
| Industry employment | 2003 (‘000) | 2007 (‘000) | 2008 (‘000) | June 2008 % of total | %change 2003-2008 | %change 2007-2008 |
|---|---|---|---|---|---|---|
| Primary35 | 16.9 | 16.9 | 14.7 | 7.1 | -12.9 | -12.9 |
| Manufacturing | 35.4 | 33.8 | 33.5 | 16.2 | -5.3 | -1.0 |
| Construction | 12.7 | 20.9 | 20.2 | 9.8 | 58.3 | -3.7 |
| Wholesale & Retail | 25.8 | 28.4 | 30.5 | 14.7 | 18 | 7.4 |
| Accommodation, Cafes & Restaurants | 12.2 | 11.8 | 10.1 | 4.9 | -16.7 | -14.0 |
| Transport & Storage & Electricity | 8.7 | 11.1 | 12.8 | 6.2 | 55.0 | 12.1 |
| Communication services | 2.9 | 3.8 | 3.6 | 1.8 | 25 | -4.0 |
| Finance & Insurance | 3 | 3.1 | 3.4 | 1.6 | 14.4 | 9.8 |
| Property & Business Services | 11.6 | 15 | 15 | 7.2 | 29.4 | -0.2 |
| Education | 16.9 | 16.4 | 17.3 | 8.3 | 2.1 | 5.0 |
| Health & Community services | 14 | 19.2 | 20.9. | 10.1 | 49.3 | 9.1 |
| Other services | 23.2 | 22.2 | 22.5 | 10.9 | -2.9 | 1.6 |
| Total Employed | 184.5 | 204.9 | 207 | 100 | 12.2 | 1.0 |
Source: Household Labour Force Survey, Statistics New Zealand
30 Labour Force Participation Rate is the total Labour Force divided by Working-Age Population.
31 Employment Rate is the Total Employed divided by Working-Age Population.
32 Unemployment Rate is the Total Unemployed divided by Total Labour Force.
33 Youth Unemployment Rate is number of unemployed youths aged 15-19 years divided by total number of youths in the labour force aged 15-19 years.
34 Long Term Unemployment Rate is all persons 15 years and over unemployed for more than 26 weeks divided by Total Labour Force.
35 Primary Industry includes Agriculture, Horticulture, Forestry & Fishing & mining.
Figure 1: Māori School Leavers, by qualification, and Māori Tertiary Enrolments
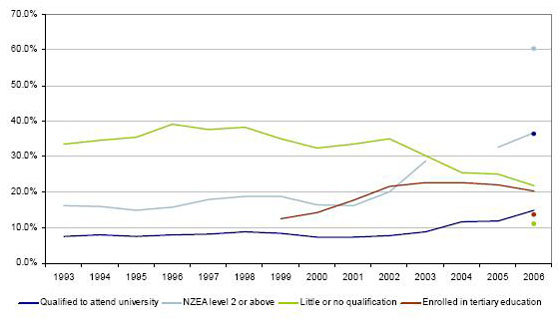
Source: Ministry of Education
The dots on Figure 1 show the level of these indicators in 2006 for New Zealand as a whole. All but the tertiary education enrolment rate imply significant disparities for Māori relative to non-Māori.
In 2006, 85,733 Māori students participated in tertiary education. The majority of Māori students were studying at institutes of technology/polytechnics, wānanga, and private training establishments. In 2006, 14,283 Māori students were studying in bachelor level qualifications, and 2,956 Māori students were studying in post-graduate level qualifications. Between 2003 and 2006 the number of Māori students enrolled in colleges of education dropped approximately 70 percent.
High rates of enrolment in tertiary education for Māori partly reflect the more youthful Māori population. However age-standardised participation rates show that Māori participation in tertiary education is highest of all ethnic groups even taking age into account. Closer inspection reveals that Māori participation in tertiary education is heavily skewed towards enrolments in NCEA level 1-4 (sub-degree) qualifications (see Figure 2). Māori enrolment in bachelors and post-graduate qualifications has remained relatively static between 1999 and 2006.
Figure 2: Enrolment in Tertiary Education, by Qualification Level
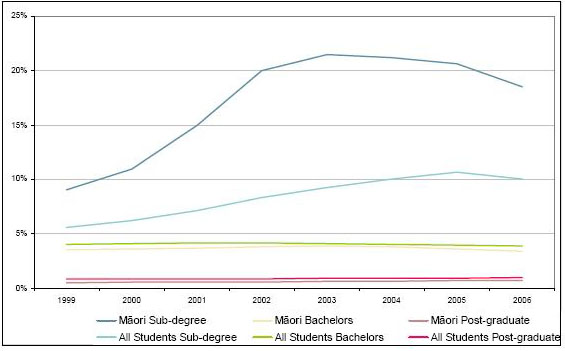
Source: Ministry of Education
Figure 3 indicates that there are significant gender differences in Māori tertiary enrolment, with Māori men significantly less likely to enrol in both sub-degree and degree and higher qualifications.
Figure 3: Māori Tertiary Enrolment, by Gender and Qualification Level
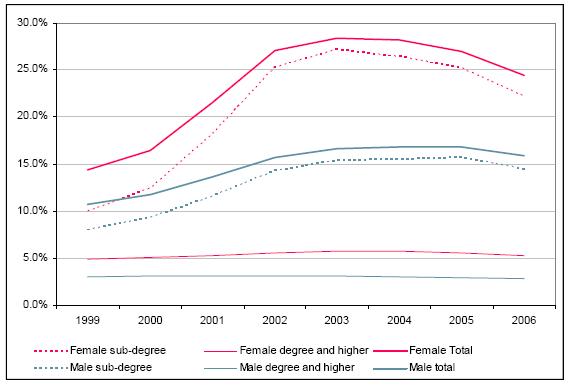
Source: Ministry of Education
Over all tertiary levels, Māori have lower 5-year qualification completion rates than non-Māori, although there are considerable differences depending on the level of study. For example, the 5-year completion rates for bachelors degrees (post-graduate qualifications) are 36% (53%) for Māori compared with 50% (65%) overall. By contrast, Māori have higher 5-year completion rates for sub-degree programmes compared with non-Māori (46% compared with 57%).
Figure 4: Tertiary Enrolments, by Field of Study
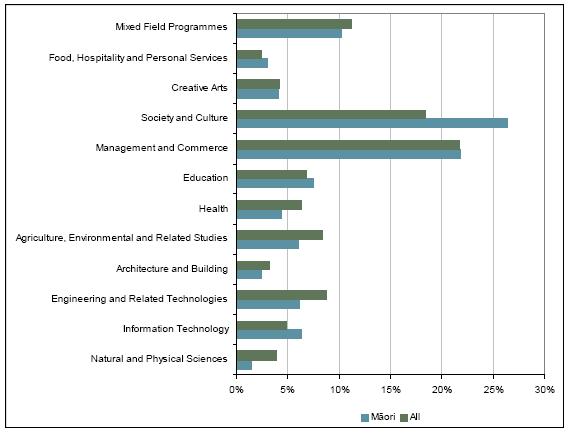
Source: Ministry of Education
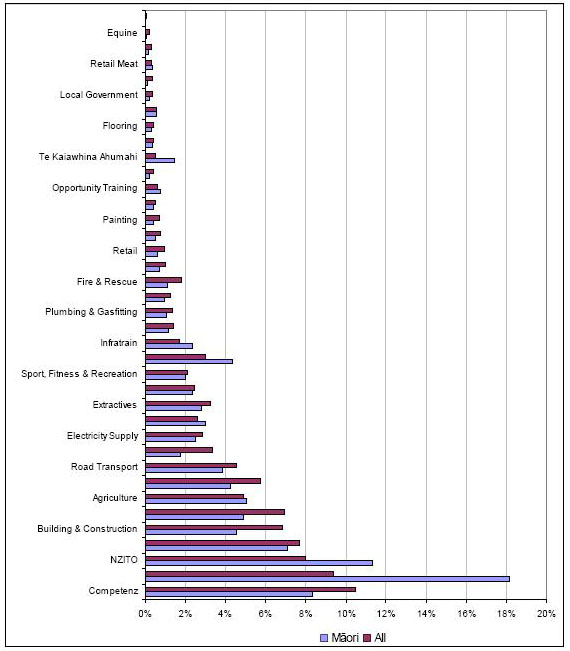
Figure 5 shows a snapshot of participation in industry and work-based training by sector in 2006, which demonstrates the different patterns of Māori participation compared with the pattern for all industry trainees.
Figure 5: Industry Trainees, by Sector
Source: Industry Training Federation
Literacy and numeracy
On the ALL proficiency measurement scale from one to five, with level three or above described as the skill level needed for people to fully participate in a knowledge-based economy, approximately 60 percent of Māori adults measured at document literacy levels one and two, and approximately 75 percent measured at numeracy levels one and two